How to Get Synthetic Monitoring Up and Running in New Relic

Ever wondered how users from different locations experience your website? Are you proactively checking for broken links, slow loading times, or even expiring certificates? If these questions pique your interest, then synthetic monitoring in New Relic is your answer!
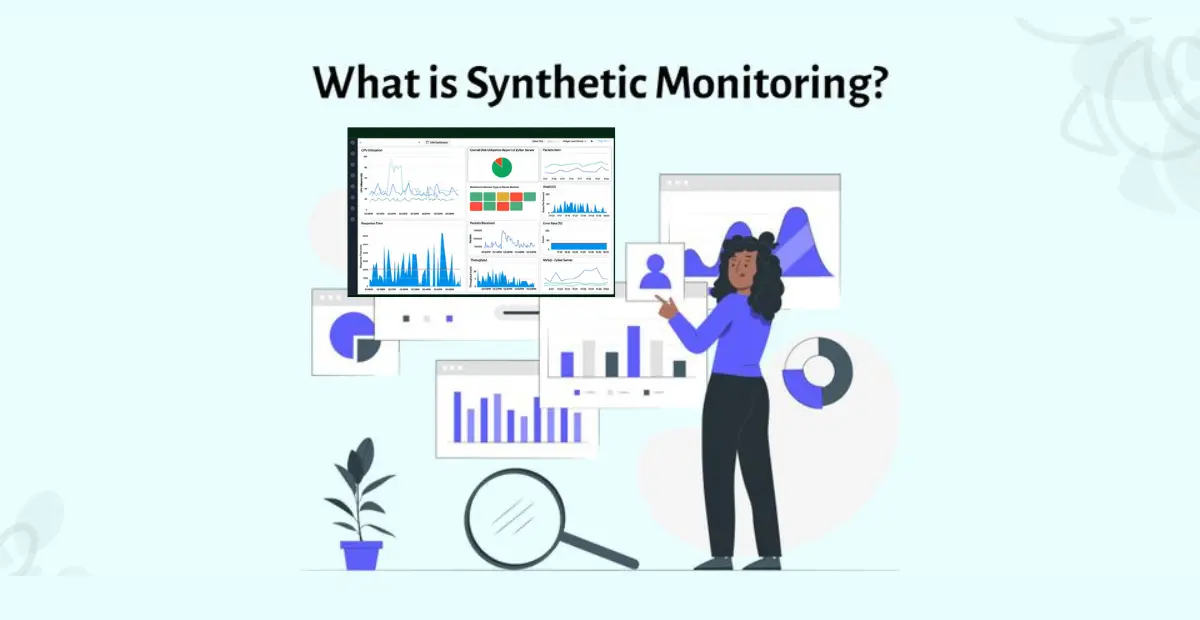
Synthetic monitoring helps you simulate real user journeys and proactively identify issues before they impact your actual users. This blog post will guide you through setting up synthetic monitoring in New Relic, empowering you to ensure a seamless user experience across the globe.
Why Use Synthetic Monitoring in New Relic?
Here are some compelling reasons to leverage synthetic monitoring in New Relic:
- Proactive identification of issues: Catch performance problems before they hinder real users, preventing potential frustration and lost revenue.
- Global perspective: Monitor your website’s performance from multiple locations worldwide, ensuring a consistent experience for users irrespective of their geographical location.
- Faster troubleshooting: Quickly pinpoint the root cause of issues by analyzing detailed transaction data and identifying specific steps causing delays.
- Improved user experience: By proactively addressing performance issues, you can guarantee a smooth and enjoyable experience for your users, fostering trust and loyalty.
Getting Started with Synthetic Monitoring
Setting up synthetic monitoring in New Relic is a breeze. Follow these steps to get started:
1 ) Navigate to Synthetic Monitoring: Within your New Relic account, go to All Capabilities > Synthetic Monitoring.
2 ) Create a Monitor: Click the Create Monitor button and choose the type of monitor you wish to create. New Relic offers various options, including:
- Scripted Browser Monitor: Simulates user journeys through custom JavaScript code, allowing you to test specific functionalities like login or checkout processes.
- Ping Monitor: Checks if your website is online and accessible from different locations.
- Broken Links Monitor: Identifies any broken or malfunctioning links on your website.
- Certificate Check Monitor: Proactively monitors the expiration date of your SSL certificate, preventing potential security vulnerabilities.
3 ) Configure Your Monitor: Provide a descriptive name for your monitor and choose the locations from which you want to run the tests. You can select individual locations or predefined regions like North America or Europe.
4 ) Define Frequency and Notifications: Set the frequency for running the monitor (e.g., every 5 minutes) and configure notification preferences. New Relic allows you to receive alerts via email, Slack, or other integrations if the monitor detects any issues.
5 ) Customize and Save: Depending on the chosen monitor type, you might need to further customize the configuration. For example, in a scripted browser monitor, you would write JavaScript code to simulate the desired user journey.
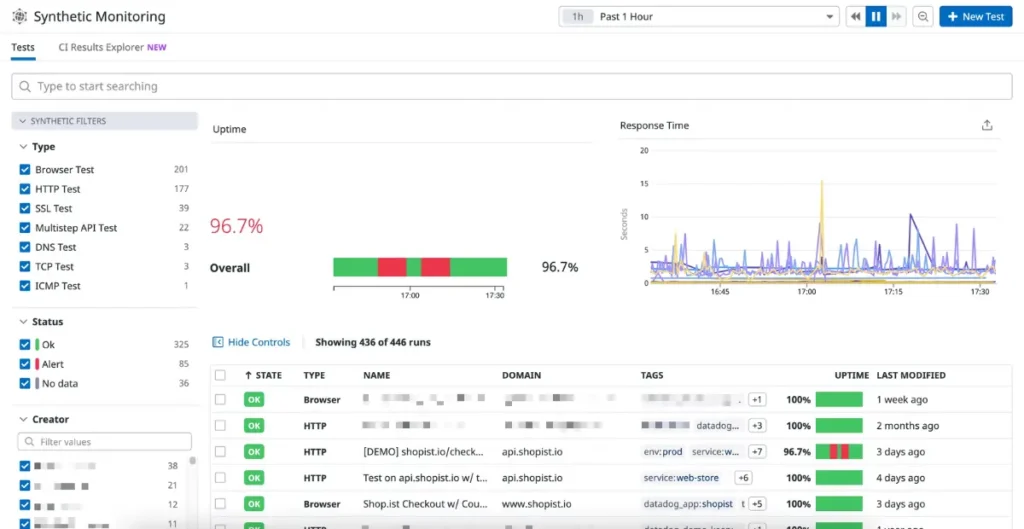
6 ) Run and Analyze: Once the monitor is saved, New Relic will start running it according to the defined frequency. You can then access the monitor dashboard to view historical data, analyze trends, and identify any performance issues.
Advanced Tips for Effective Synthetic Monitoring
- Start with critical user journeys: Prioritize monitoring essential user journeys that directly impact conversions or engagement.
- Leverage built-in features: Utilize features like step groups and assertions within scripted browser monitors to pinpoint specific areas causing delays.
- Set realistic thresholds: Establish appropriate alert thresholds based on your website’s expected performance to avoid overwhelming alerts for minor fluctuations.
- Integrate with other tools: Integrate synthetic monitoring data with other New Relic features like APM (Application Performance Monitoring) for a holistic view of your application’s health.

Top Synthetic Transaction Monitoring Tools & Software
Future Trends in Synthetics Monitoring and New Relic
The Evolving Landscape: Future Trends in Synthetics Monitoring and New Relic
Synthetic monitoring has become an indispensable tool for ensuring website performance and user experience. As technology and user expectations evolve, so too will the landscape of synthetic monitoring. Let’s delve into some exciting trends that could shape the future of synthetics monitoring, particularly within the New Relic ecosystem:

1. AI-powered anomaly detection: New Relic already utilizes machine learning to identify potential issues. In the future, expect even more sophisticated AI algorithms to analyze synthetic monitoring data, automatically detect anomalies, and predict potential performance bottlenecks before they occur. This proactive approach will enable teams to address issues even faster, minimizing downtime and impact on users.
2. Integration with real-user monitoring (RUM): The future holds a stronger convergence between synthetic and real-user monitoring. Imagine a scenario where synthetic monitors trigger RUM data capture when they detect an anomaly. This combined approach will provide a more comprehensive understanding of user experience, allowing teams to pinpoint the exact user segments affected by the issue and prioritize resolutions accordingly.
3. Advanced scenario scripting: Scripting capabilities in synthetic monitoring will likely become more sophisticated, enabling the simulation of even more complex user journeys. This could include testing interactions with dynamic content, login processes with multi-factor authentication, or even personalized experiences based on user data. This enhanced functionality will allow for more thorough testing and identification of potential issues that might otherwise go unnoticed.
4. Focus on user behavior emulation: Moving beyond simply replicating website interactions, synthetic monitoring might evolve to include the emulation of specific user behaviors. This could involve simulating different user types (e.g., mobile vs. desktop users) or even mimicking user actions based on historical data or behavioral analytics. By understanding how different user segments interact with the website, teams can tailor their monitoring strategy and identify potential issues specific to each user group.
5. Integration with DevOps practices: Synthetic monitoring will likely become even more integrated with DevOps workflows. This could involve automatic deployment of synthetic monitors alongside new code releases, ensuring continuous performance monitoring throughout the development lifecycle. Additionally, alerts generated by synthetic monitors could trigger automated remediation actions, further streamlining the process of identifying and resolving issues.
New Relic’s Role in the Future:
New Relic is well-positioned to play a leading role in shaping the future of synthetic monitoring. By leveraging its existing strengths in data analysis, machine learning, and integrations with other DevOps tools, New Relic can offer a comprehensive and adaptable synthetic monitoring solution that caters to the evolving needs of modern web applications.
Here are some potential areas where New Relic could make significant contributions:
- Developing advanced anomaly detection algorithms: By further refining its machine learning capabilities, New Relic can offer even more intelligent anomaly detection within synthetic monitoring, allowing for faster and more accurate issue identification.
- Simplifying integration with RUM: New Relic could streamline the process of integrating synthetic and real-user monitoring data, providing a unified view of user experience across different monitoring methods.
- Providing pre-built scripts for common scenarios: To simplify the setup process for users, New Relic could offer a library of pre-built scripts for common user journeys and functionalities, reducing the need for extensive custom scripting.
- Building stronger DevOps integrations: New Relic could further integrate synthetic monitoring data and alerts into existing DevOps tools, enabling seamless issue identification and resolution within existing workflows.
FAQs
Q: What is synthetics monitoring? Synthetics monitoring involves simulating user interactions with applications to ensure optimal performance and identify potential issues.
Q: Why choose New Relic for synthetics monitoring? New Relic offers advanced features, user-friendly interfaces, and robust capabilities that make it a top choice for synthetics monitoring.
Q: How do I troubleshoot common issues in synthetics monitoring? Our troubleshooting guide provides step-by-step solutions to address common challenges in synthetics monitoring.
Q: Can I integrate synthetics monitoring with other New Relic features? Yes, integrating synthetics monitoring with other features enhances your overall application monitoring capabilities.
Q: What business impact does synthetics monitoring have? Synthetics monitoring positively influences user satisfaction, cost savings, and overall business performance.
Q: Are there real-world success stories of synthetics monitoring in New Relic? Yes, numerous organizations have achieved significant success by leveraging synthetics monitoring in New Relic.


